Analytics View
The Analytics view displays aggregated conversational statistics for all dialog sessions held with your AI agent. Here, you can see what your target audience is, how your customers behave and what they say.
Note
Alan AI’s analytics is designed with respect to users’ privacy and security. While collecting and analyzing conversational data, Alan AI keeps users’ personal details private and shows anonymized speech-to-text logs of users’ utterances.
To open the Analytics View:
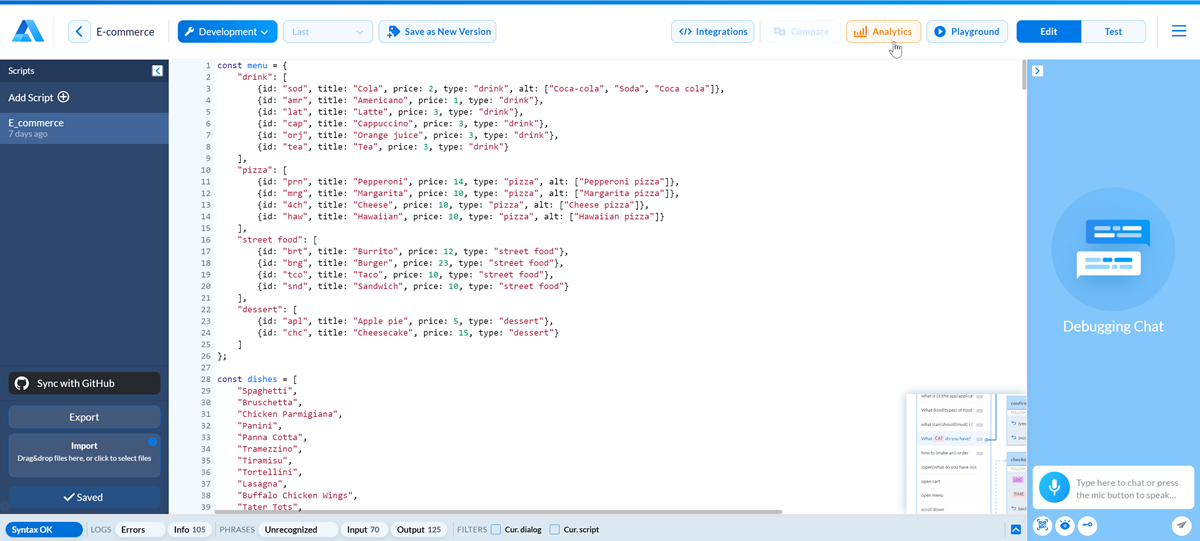
In Alan AI Studio, open the project for which you want to view conversational analytics.
At the top of the code editor, click Analytics.
While working with the Analytics View, you can:
Switch between environments: at the top of the Analytics view, click the environment button and select the necessary environment: Development, Testing or Production. For more details about Alan AI environments, see Versions and environments.
Display the latest conversational data in widgets: at the top of the Analytics view, click Refresh Data.
Filtering and comparing datasets
By default, the Analytics View displays statistics for the whole project lifetime. To effectively analyze conversational data, you can filter available information and compare several subsets of data side by side.
To create new data subset:
To the right of the initial dataset, click the plus icon to add a new data subset.
At the top of the pane, provide a name for the created data subset.
Use the period filter at the top of the pane to select the time span for which conversational data must be displayed.
For your convenience, you can:
Drill down into a specific data slice, either for a single subset of data or all data subsets. To bring the widgets to the foreground, click the compare or expand icon in the top right corner of a widget in the necessary row.
Collapse the widgets: to collapse or expand a widget, click the arrow icon to the left of the widget name.
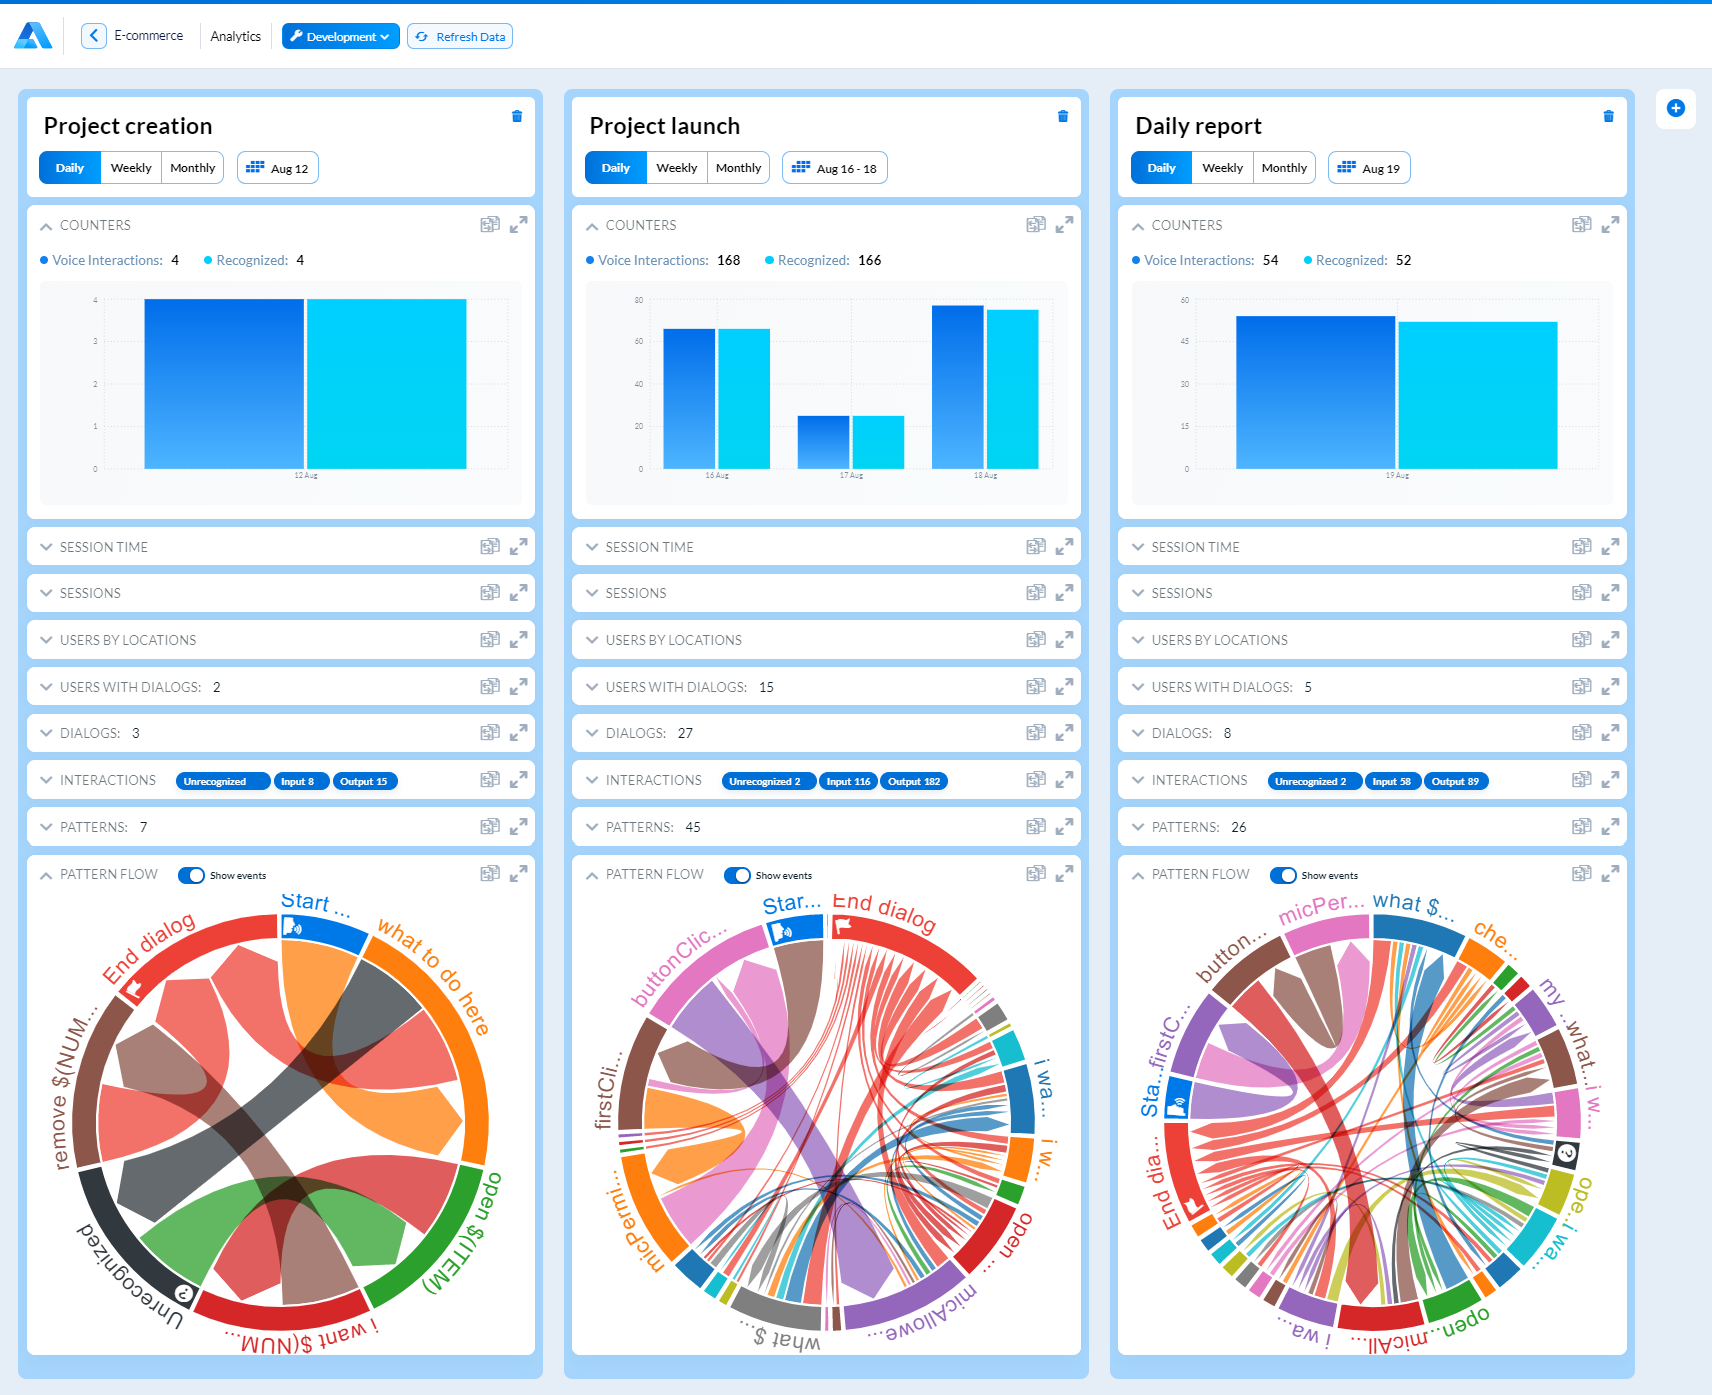
Understanding the widgets
The Analytics view presents the following widgets:
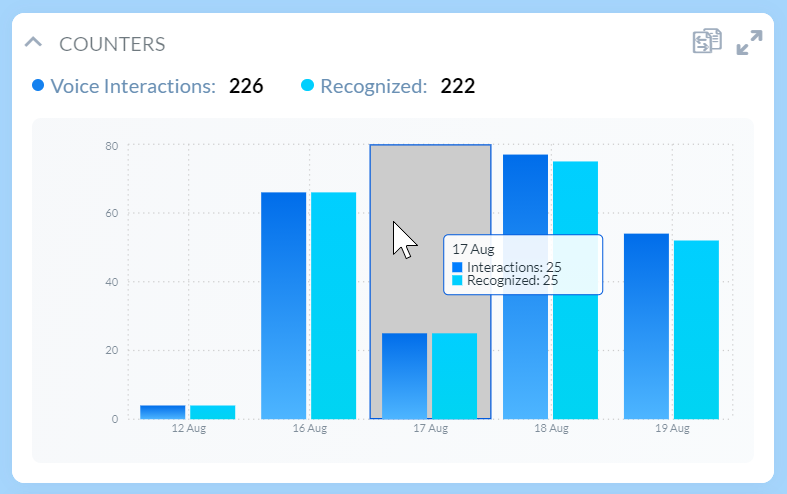
Counters
This widget displays the total number of users’ utterances vs. utterances that Alan AI was able to recognize and match to user’s commands in project scripts.
Hover over the bar in the chart to see the exact number of utterances for a specific period.
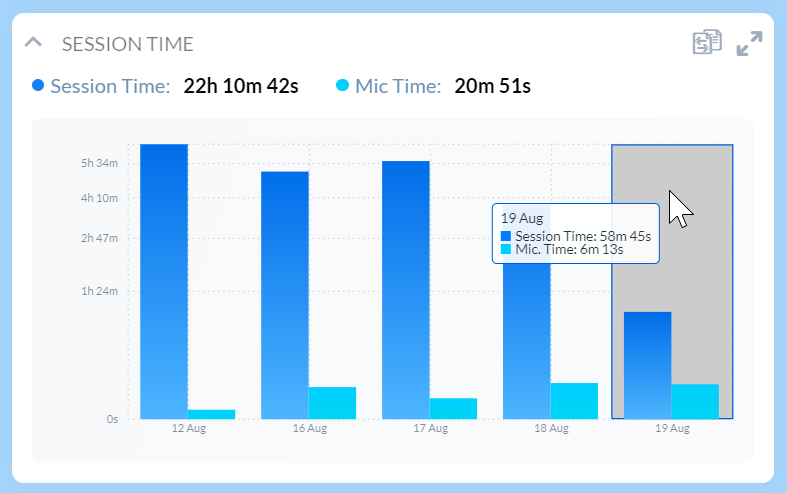
Session time
This widget displays the total dialog session time vs. the amount of time for which the microphone was active.
Hover over the bar in the chart to see the session duration for a specific period.
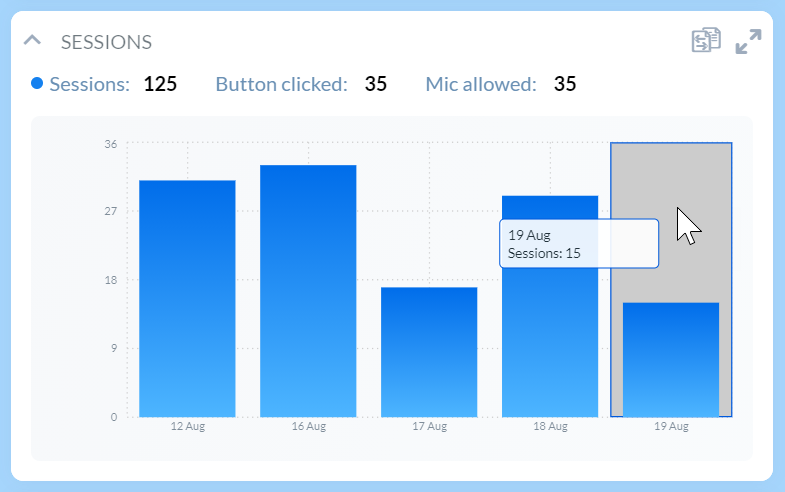
Sessions
This widget reports on the total number of dialog sessions. It also shows the number of times the AI agent button was clicked and microphone access for the AI agent was allowed during dialog sessions.
Hover over the bar in the chart to see the exact number of sessions for a specific period.
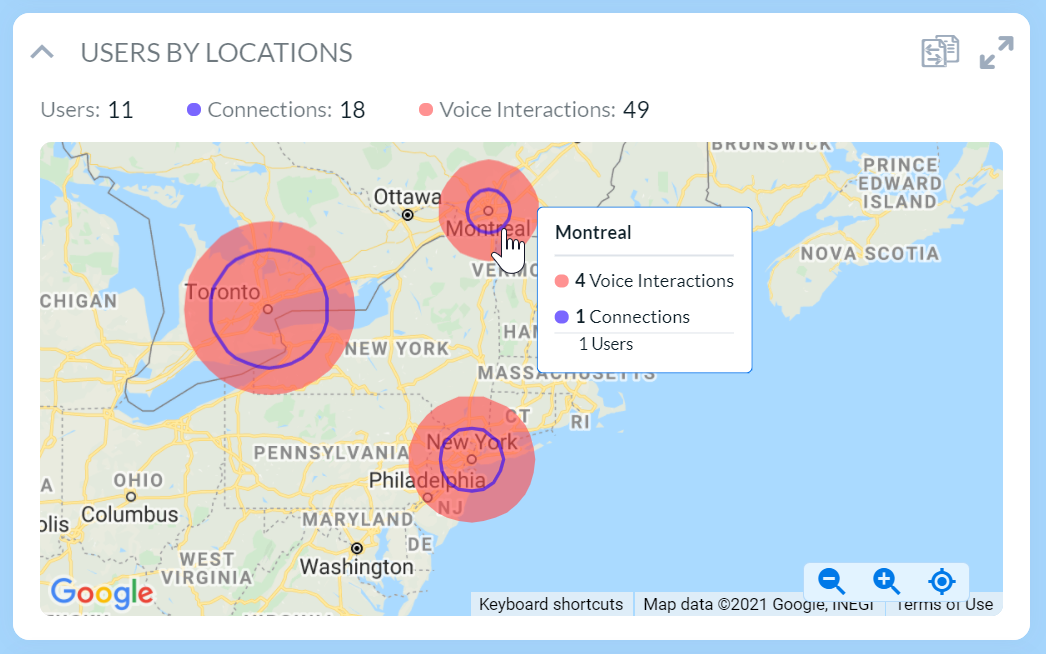
Users by locations
This widget displays users’ geographic locations.
Hover over a circle on the map to learn about the actual number of users, conversational interactions and connections to the AI agent in a specific location.
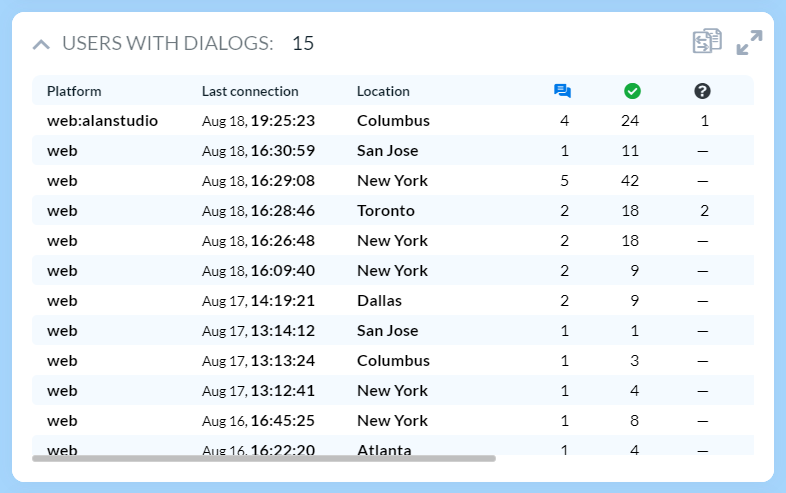
Users with dialogs
This widget reports on the number of users interacting with the AI agent and provides detailed statistics for these users, including:
Platform from which the user joined
Time of the latest connection
User’s location
Number of dialogs
Recognized, unrecognized utterances and errors in dialogs
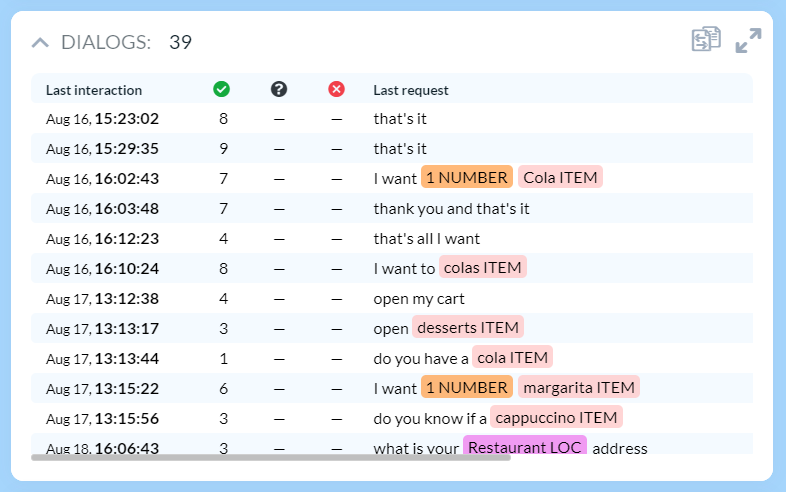
Dialogs
This widget reports on the dialogs that users had with the AI agent.
To see all dialogs for a specific user, in the Users with dialogs widget, select the user line.
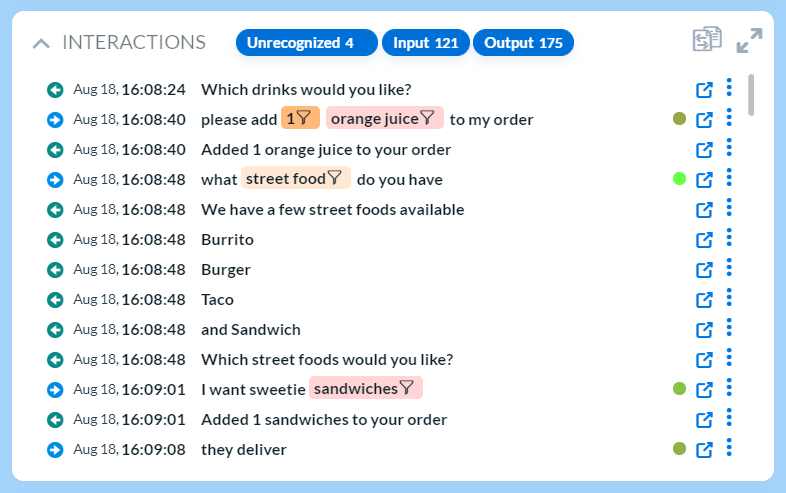
Interactions
This widget is a great source of information as it displays the transcript for all dialogs with all users.
To get the required data slice, you can filter data in the following way:
To filter unrecognized, input or output interactions, use the filter at the top of the widget.
To filter interactions by dialog or pattern, in the Dialogs or Pattern widget, select the necessary line.
To filter interactions by entities in users’ utterances, for example, by number, location or an item, in the interactions list, click the filter icon next to the necessary entity.
To get the match score, hover over the circle to the right of the interaction. The brighter is the icon color, the more accurate is the match.
To view the details, click the interaction line or the More icon to the right of it.
To jump to the code block in the code editor, click the Open link icon to the right of the interaction.
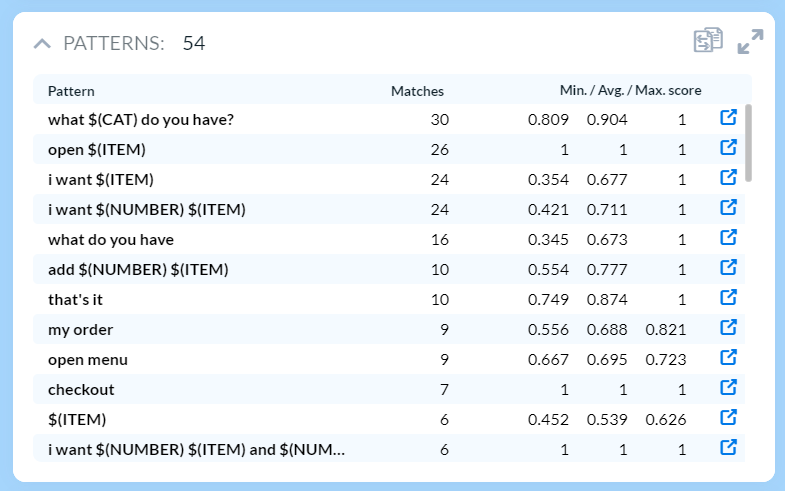
Patterns
This widget displays all patterns of the user’s commands that users gave, the number of matches and the match scores.
To jump to the code block in the code editor, click the Open link icon to the right of the pattern.
Pattern flow
This widget visually displays how the conversation with users flows: where they start, continue and finish the dialog with the AI agent.
The widget helps you analyze the sequence of users’ activities – user events and matched patterns, to understand users’ behavior and design a robust conversational experience.
The widget depicts users’ activities as slices laid out around the circle. To read the widget data, do the following:
To display or hide user events, use the Show events toggle at the top of the widget.
To see when an event occurred or a pattern was matched in the dialog, hover over its slice in the circle. Alan AI Studio will display the previous and next activity in the conversation flow.
To get the exact number of event occurrences or pattern matches, hover over the slice and notice the number in the box in the top left corner of the widget.
To get information about the number of users following a specific activity sequence, hover over the arrow between slices. The arrow width indicates the flow frequency: the more often the sequence was followed, the wider the arrow is.
To filter data in the widget by dialog or pattern, in the Dialogs or Pattern widget, select the necessary line.