Reasoning graphs
For each interaction, Alan AI creates a reasoning graph that shows the AI’s reasoning process. Reasoning graphs provide a visual structured representation of how the AI system receives input data, makes decisions and generates responses. Reasoning graphs enhance transparency and let you better understand the logic behind AI’s actions.
To open a reasoning graph, do either of the following:
In Alan AI Studio, go to Analytics, scroll down to Interactions widget and click the chart icon to the right of the necessary interaction.
In Alan AI Studio, open the Alan AI Studio logs, make sure the Output filter is on and in the interactions list, click the chart icon to the right of the necessary interaction.
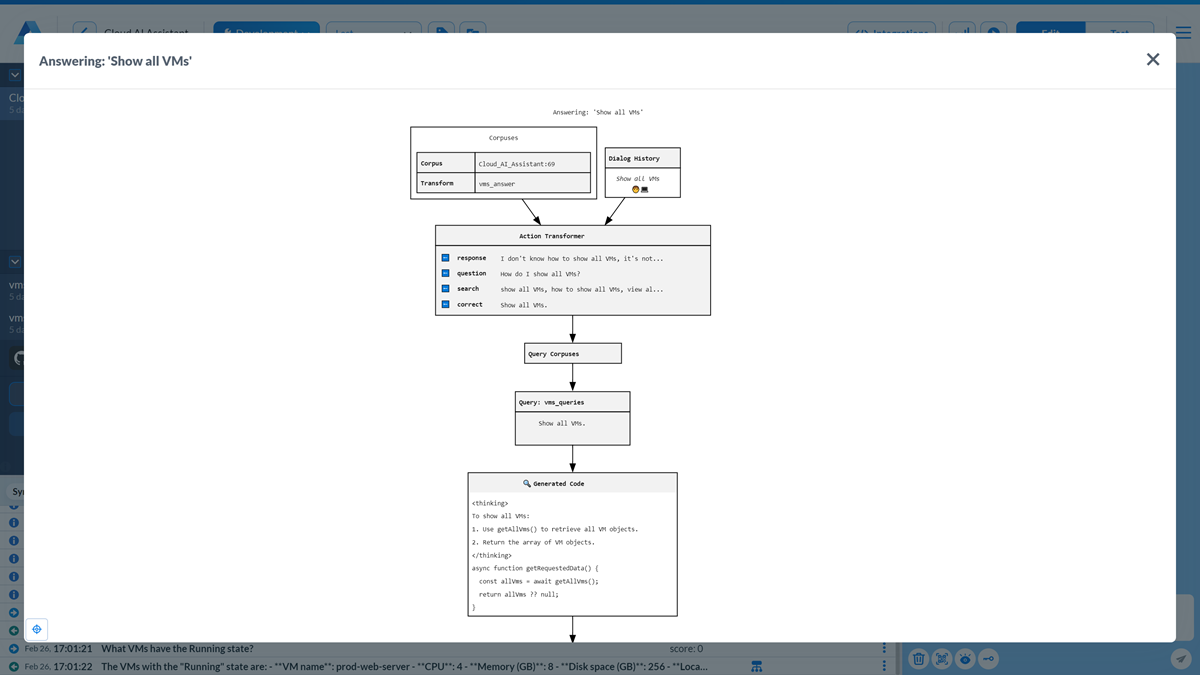
Reasoning graphs capture all steps involved in the AI’s decision-making. They include:
Data corpuses allow you to understand what input data sources are utilized in the reasoning process.
Dialog history enables you to track the dialog history, see asked phrases and the context in which they were posed.
Decision flows of the Action Transformer showcase how the AI model determines the appropriate actions based on the input data and dialog context.
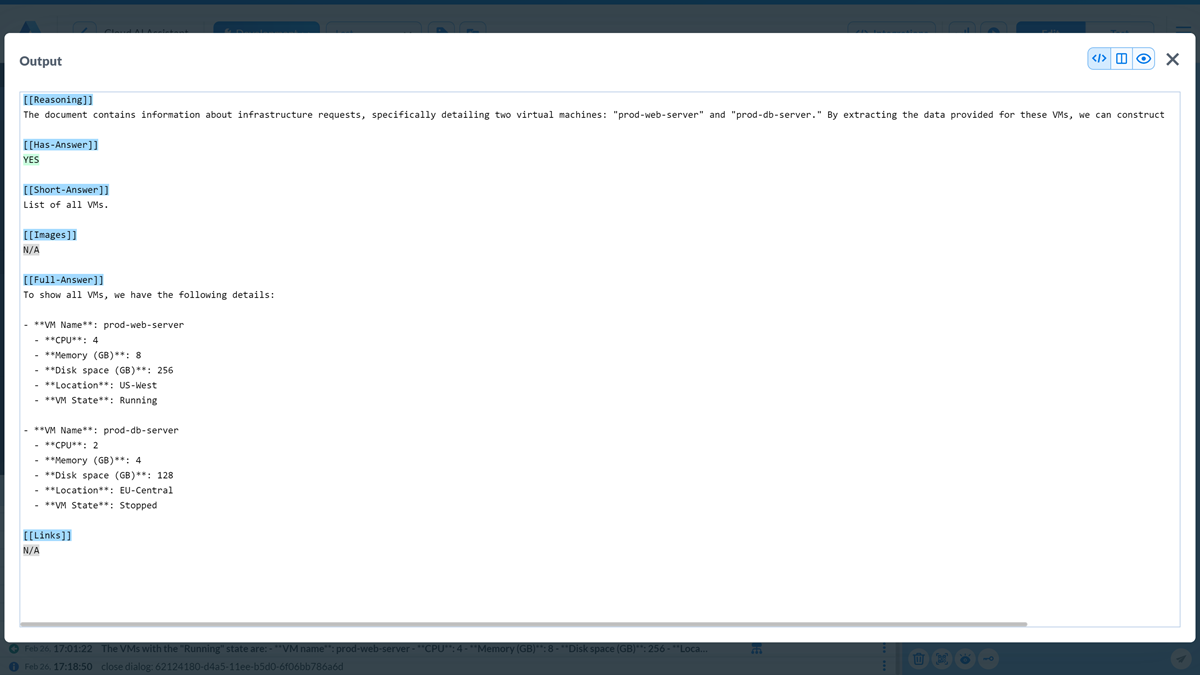
Generated code and result blocks display the generated code and its corresponding result, providing insights into the computational processes underlying the AI’s actions.
Output allows you to understand how the AI assistant formulates its replies based on the input data and provided transforms.
When using a reasoning graph, you can drill down into a specific area of interest to view detailed reasoning data. To do so, click on the corresponding block in the graph.