Viewing the script flowchart
To get a visual representation of your dialog script, you can use the flowchart panel in Alan AI Studio. The flowchart can help you better understand the script workflow, analyze its design and identify potential flaws.
The flowchart panel is located at the bottom right of the code editor. To expand it, in the bottom left corner of the panel, click the expand icon.
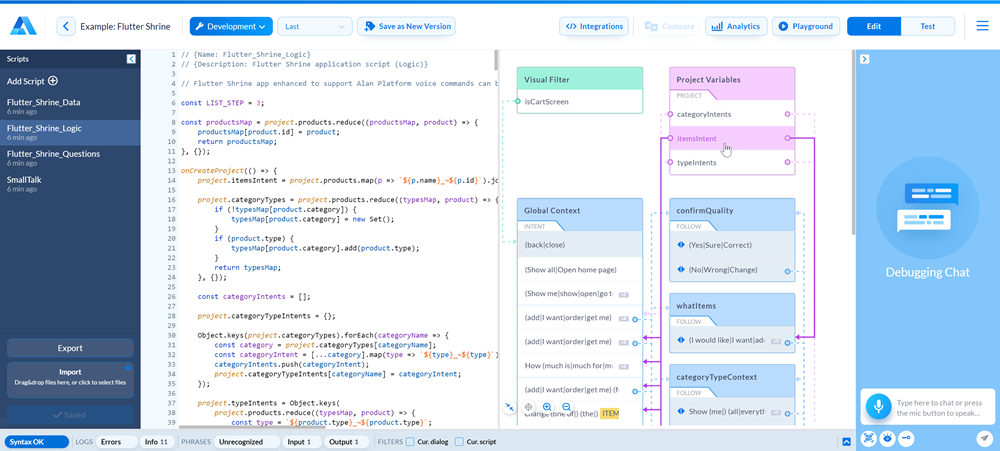
The flowchart presents the dialog script as a diagram consisting of a set of blocks — the global context and user-defined contexts. The global context is depicted on the left, while user-defined contexts are available on the right. All user’s commands added to the dialog script belong to this or that context block.
User-defined contexts are connected to user’s commands with arrows. This way, you can easily see from which place in the script a context is activated. In a script with a great number of contexts, the number of connections can be great as well. To see how a specific element is linked with others, hover over it, and all connections going from or pointing at it will be highlighted.
For even better visualization, Alan AI displays the following script objects in the flowchart:
Slots added to user’s commands are presented as colored blocks inside commands.
Visual filters are presented in the block at the top left of the chart.
Project variables are presented in the block at the top right of the chart.
Visual filters and project variables are linked to user’s commands in which they are used.
Note
If the dialog script contains no user’s commands, only configuration and data structures, the flowchart will be empty.
Helpful tips
Here are some tips you can follow when working with the flowchart:
To zoom in and out in the flowchart, click the plus and minus icons in the bottom left corner of the flowchart.
To go to the necessary line in the dialog script, click the block or element in the flowchart.
And, vice versa, to see what element in the flowchart corresponds to a specific line of code in the script, in the bottom left corner of the flowchart, click the target icon so that it becomes enabled and then click the necessary line in the code editor. The corresponding element in the flowchart will be highlighted.
If a voice command has several alternatives, only the first command is displayed in the command block. The number of remaining alternatives is displayed at the right of the block. To see all possible variants, hover over the command block.
To make more room for the flowchart and the code editor, collapse the scripts list and, if you are not planning to test your user’s commands, the Debug Chat. To do this, at the top of the code editor, click the left and right arrow buttons.